Introduction
VMware NSX-T 3.2 comes with NSX Application Plaform. This platform needs to run on a Kubernetes cluster.
So why not build a vSphere with Tanzu cluster. While I was building the platform and making notes, I ended up with a working Tanzu platform ready for the NSX Application platform. I deleted the whole setup to create a blog of all steps so you can also benefit from it.
vSphere with Tanzu is the new generation of vSphere for containerized applications. This single, streamlined solution bridges the gap between IT operations and developers with a new kind of infrastructure for modern, cloud-native applications both on-premises and in public clouds.
The goal of this blog
The goal of this blog is to get the NSX Application Platform (NAPP) deployed
This blog is part 4 of 4
Please follow all the steps in the previous part before you install NAPP
You can find part 1 here and part 2 here and part 3 here
- Create a service account
We need a service account. Normal users are being logged out after a period of time. A service account prevents this.
- Login
- switch to the correct context
- create a service account
$ kubectl vsphere login --server=10.4.205.2 --insecure-skip-tls-verify --tanzu-kubernetes-cluster-name tkgs-v2-cluster-default -
-tanzu-kubernetes-cluster-namespace nsx-application-platform
Username: chrism
KUBECTL_VSPHERE_PASSWORD environment variable is not set. Please enter the password below
Password:
Logged in successfully.

You have access to the following contexts:
   10.4.205.2
   nsx-application-platform
   tkgs-v2-cluster-default

If the context you wish to use is not in this list, you may need to try
logging in again later, or contact your cluster administrator.

To change context, use `kubectl config use-context <workload name>`
$ kubectl config use-context tkgs-v2-cluster-default
Switched to context "tkgs-v2-cluster-default".
$ kubectl create serviceaccount napp-admin -n kube-system
$ kubectl create clusterrolebinding napp-admin --serviceaccount=kube-system:napp-admin --clusterrole=cluster-admin
2. Creating the kubectl file
This code will create a file called ‘kubectl.txt’ which needs to be uploaded to the NSX manager. In Kubernetes, the file is called ‘.config’
SECRET=$(kubectl get serviceaccount napp-admin -n kube-system -ojsonpath='{.secrets[].name}')
TOKEN=$(kubectl get secret $SECRET -n kube-system -ojsonpath='{.data.token}' | base64 -d)
kubectl get secrets $SECRET -n kube-system -o jsonpath='{.data.ca\.crt}' | base64 -d > ./ca.crt
CONTEXT=$(kubectl config view -o jsonpath='{.current-context}')
CLUSTER=$(kubectl config view -o jsonpath='{.contexts[?(@.name == "'"$CONTEXT"'")].context.cluster}')
URL=$(kubectl config view -o jsonpath='{.clusters[?(@.name == "'"$CLUSTER"'")].cluster.server}')
TO_BE_CREATED_KUBECONFIG_FILE="kubectl.txt"
kubectl config --kubeconfig=$TO_BE_CREATED_KUBECONFIG_FILE set-cluster $CLUSTER --server=$URL --certificate-authority=./ca.crt --embed-certs=true
kubectl config --kubeconfig=$TO_BE_CREATED_KUBECONFIG_FILE set-credentials napp-admin --token=$TOKEN
kubectl config --kubeconfig=$TO_BE_CREATED_KUBECONFIG_FILE set-context $CONTEXT --cluster=$CLUSTER --user=napp-admin
kubectl config --kubeconfig=$TO_BE_CREATED_KUBECONFIG_FILE use-context $CONTEXT
3. Upload kubectl.txt to NSX manager
Open the kubectl.txt file. It will look something like this.
Copy the file to a place where you can upload it to the NSX manager from. See step
apiVersion: v1
clusters:
- cluster:
    certificate-authority-data: LS0tLS1CRUdJTiBDRVJUSUZJQ0FURS0tLS0tCk1JSUM2akNDQWRLZ0F3SUJBZ0lCQURBTkJna3Foa2lHOXcwQkFRc0ZBREFWTVJNd0VRWURWUVFERXdwcmRXSmwKY201bGRHVnpNQjRYRFRJeU1ERXdNekV4TkRFMU1Gb1hEVE15TURFd01URXhORFkxTUZvd0ZURVRNQkVHQTFVRQpBeE1LYTNWaVpYSnVaWFJsY3pDQ0FTSXdEUVlKS29aSWh2Y05BUUVCQlFBRGdnRVBBRENDQVFvQ2dnRUJBTGRpCjZGeC9ORGhwSmFGNXhzK2I3czU5bjA5NEF1Sjd2WjJ0THFBdnlBVWdta0NTSmhkYzZiNTBiT3lkWnFkRW5BRHAKVjlMcHE4WEJkZXpiMk0yVnZyRENTaU5pRWtuSVFTS2padDJVL3lHSE9FZVNvWHMraTkyU2ZKN2ZRNFR4SXRYOQphOGxmVm5uLy9OTzIramlvdEFQanpuWURJaERaTlp0UXJTL21LczBXSHc0TEFIY3JCdmFUN3g5NkUveCtvbmNtCmI0RjJ5SkNRVnNLSU5XVUozZzJodG5TYzVGYXBKZzJlNlJ3a0dhNkZiUDAAAyswblhZZE1KZE43YkJiNlIzaGcKWkFtOWt0MlFGaWMwTE5UUDA5OWZiTFRVWjh0a1llbnc1cEtPVVZ2VFJOb1ZYSEdUejNWa0lZYndpdkh2M3NiWgpkbFc5b2Jndkw1a2UxM2huS1djQ0F3RUFBYU5GTUVNd0RnWURWUjBQQVFIL0JBUURBZ0trTUJJR0ExVWRFd0VCCi93UUlNQVlCQWY4Q0FRQXdIUVlEVlIwT0JCWUVGTGhMUTJoUERYVndJT1FwZjZpNHNpSWtlaEdsTUEwR0NTcUcKU0liM0RRRUJDd1VBQTRJQkFRQTdvU2krc3YvYzFTTUVRTU5QdTNtVFZrNGlGYjc4NXJDZU41RkJkbE1mc09SQwpITUU0TzdlZTg0QWNITzBRWGZoRXVNbVhYNmNqUlBLcjFJVVhEMXJHenF6K3plbTIyNEpKNlRIazVpVEFMai9QCjJBNytSaW53OEg0NXR6NUY4VGpwWGZwaFBCTUJFNG1qZEFGVEZ4TFRzdFBwUTIyQTVxQzRZNXplSDJkaE5FTjQKTm1IaHpla3FkZVZTNjkzUXJNV2FhWCtUcUEraFExWXROUnd4TnMzbEdUQlVZMGpPVHk3ckhKc3NaNUZSaTNFKwpYZ2lHZk8wdHFLNVBvekI5b2k0Q3ZLRXY2VXZVOWltV2o2TGw5WXVxYXh3Y3hxTGJNeDRSNzJoSnNwTzIwcXB2ClphWjF2MEUybjZicnRUbVBtTUxGN3IzS0VBNTBoUTlieURVdHluczEKLS0tLS1FTkQgQ0VSVElGSUNBVEUtLS0tLQo=
    server: https://10.4.205.3:6443
  name: 10.4.205.3
contexts:
- context:
    cluster: 10.4.205.3
    user: napp-admin
  name: tkgs-v2-cluster-default
current-context: tkgs-v2-cluster-default
kind: Config
preferences: {}
users:
- name: napp-admin
  user:
    token: eyJhbGciOiJSUzI1NiIsImtpZCI6ImUxeHhkOVBUdkxuQlE1UHMtb3h0S0ZTTDRIVzBQdjdFWkRWUHB5V3FKbWcifQ.eyJpc3MiOiJrdWJlcm5ldGVzL3NlcnZpY2VhY2NvdW50Iiwia3ViZXJuZXRlcy5pby9zZXJ2aWNlYWNjb3VudC9uYW1lc3BhY2UiOiJrdWJlLXN5c3RlbSIsImt1YmVybmV0ZXMuaW8vc2VydmljZWFjY291bnQvc2VjcmV0Lm5hbWUiOiJuYXBwLWFkbWluLXRva2VuLXNtdDRiIiwia3ViZXJuZXRlcy5pby9zZXJ2aWNlYWNjb3VudC9zZXJ2aWNlLWFjY291bnQubmFtZSI6Im5hcHAtYWRtaW4iLAArdWJlcm5ldGVzLmlvL3NlcnZpY2VhY2NvdW50L3NlcnZpY2UtYWNjb3VudC51aWQiOiIxN2Q0M2Y2MC01Yjc1LTQwNjYtODBmMC00MTQxZWQyMjM5YjkiLCJzdWIiOiJzeXN0ZW06c2VydmljZWFjY291bnQ6a3ViZS1zeXN0ZW06bmFwcC1hZG1pbiJ9.RF47-y7Ea8_jG-L2hSrLWV51e2j6dZ7N_V0mfGbFrhs7B-by9sNgAr8q7GQE2pvDyHGbUDtxEXoKf8G71PM3YwN5kw-xHDdIcYNMI1RnpFgONNkrxUM1cAi_ZDfxqn1GY4map8r1Gur47PVu1kfbT11TCXAyVIOe-QWWjMdgfVjLT7U3XBrGW_ve_TOb5ClEC5SonVCoEH_mhvXYyfiOSDTwymiLOyLMrYdT8664AdhCeKDMgT0jmK0bGarMVoMkbl0Jy2SSKydPnhIbS45zgnYkk-LKLCtt8LboxQwm97W-hUVlFPL_xNKaGx3QLbH1bNV1Wk6Hw2KSzAU8pu7Mj
Installing NSX Application Platform
- Start the install
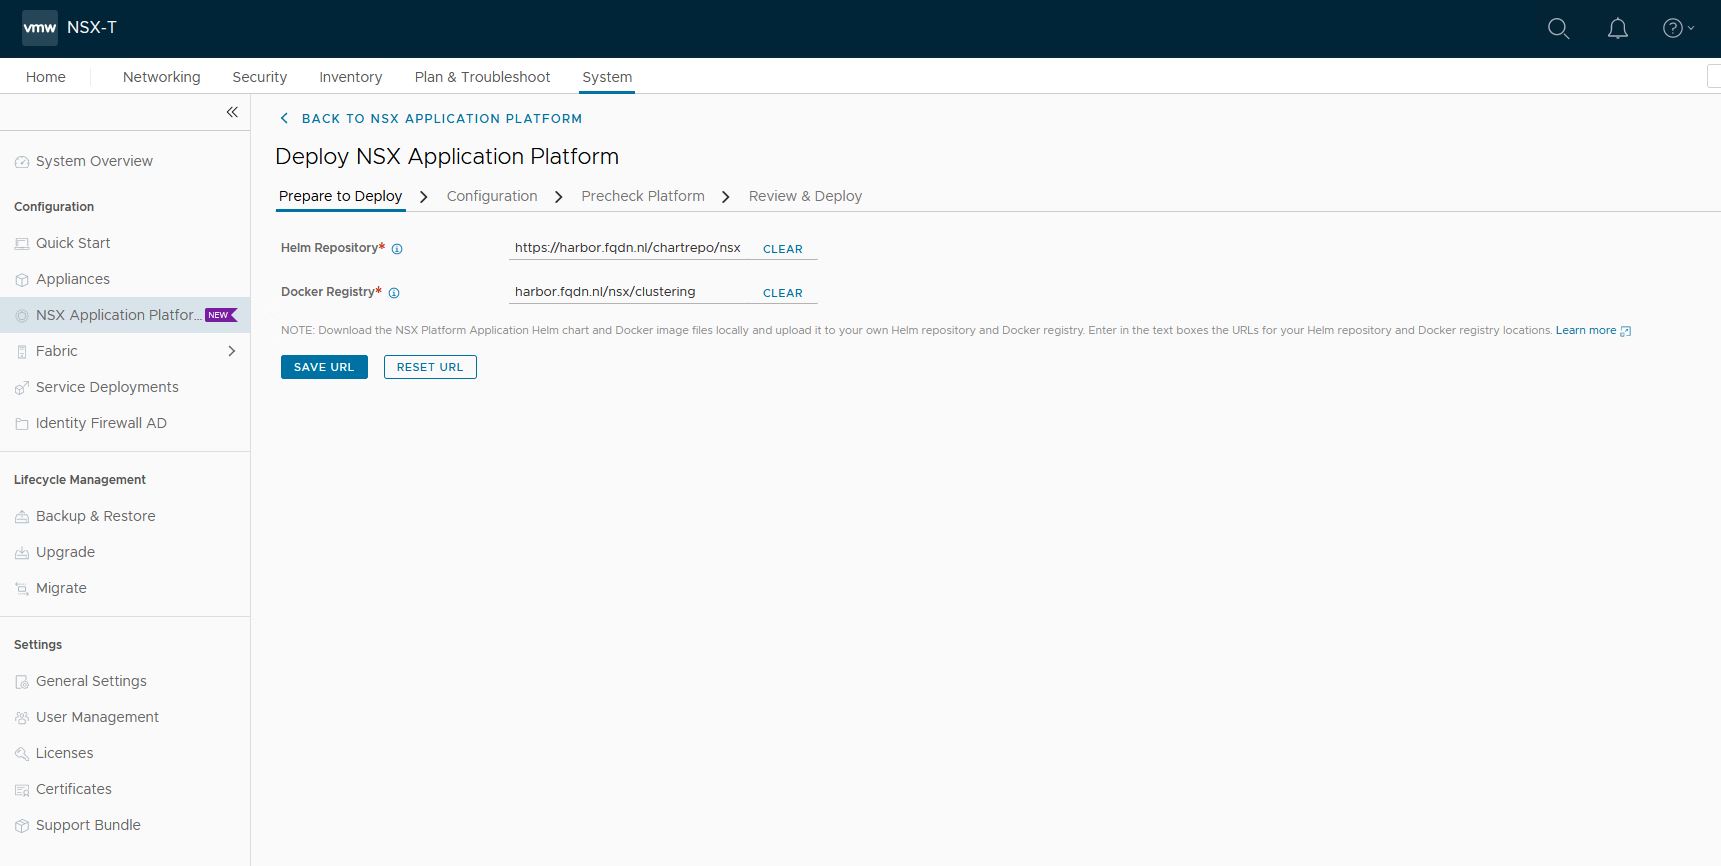
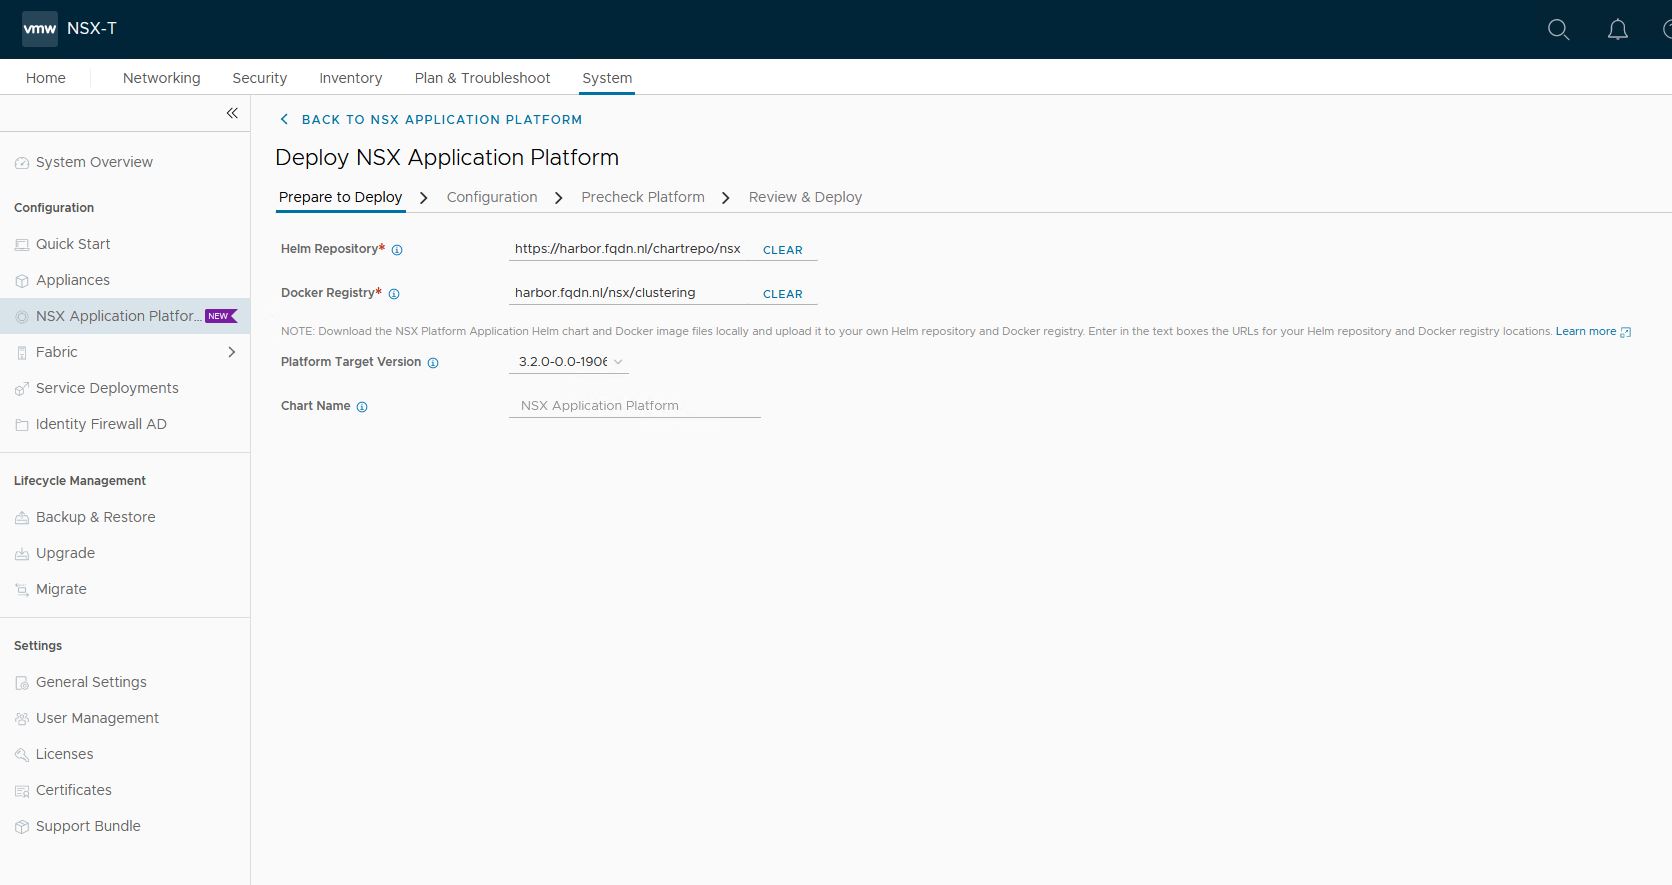
Goto System->NSX Application Platform
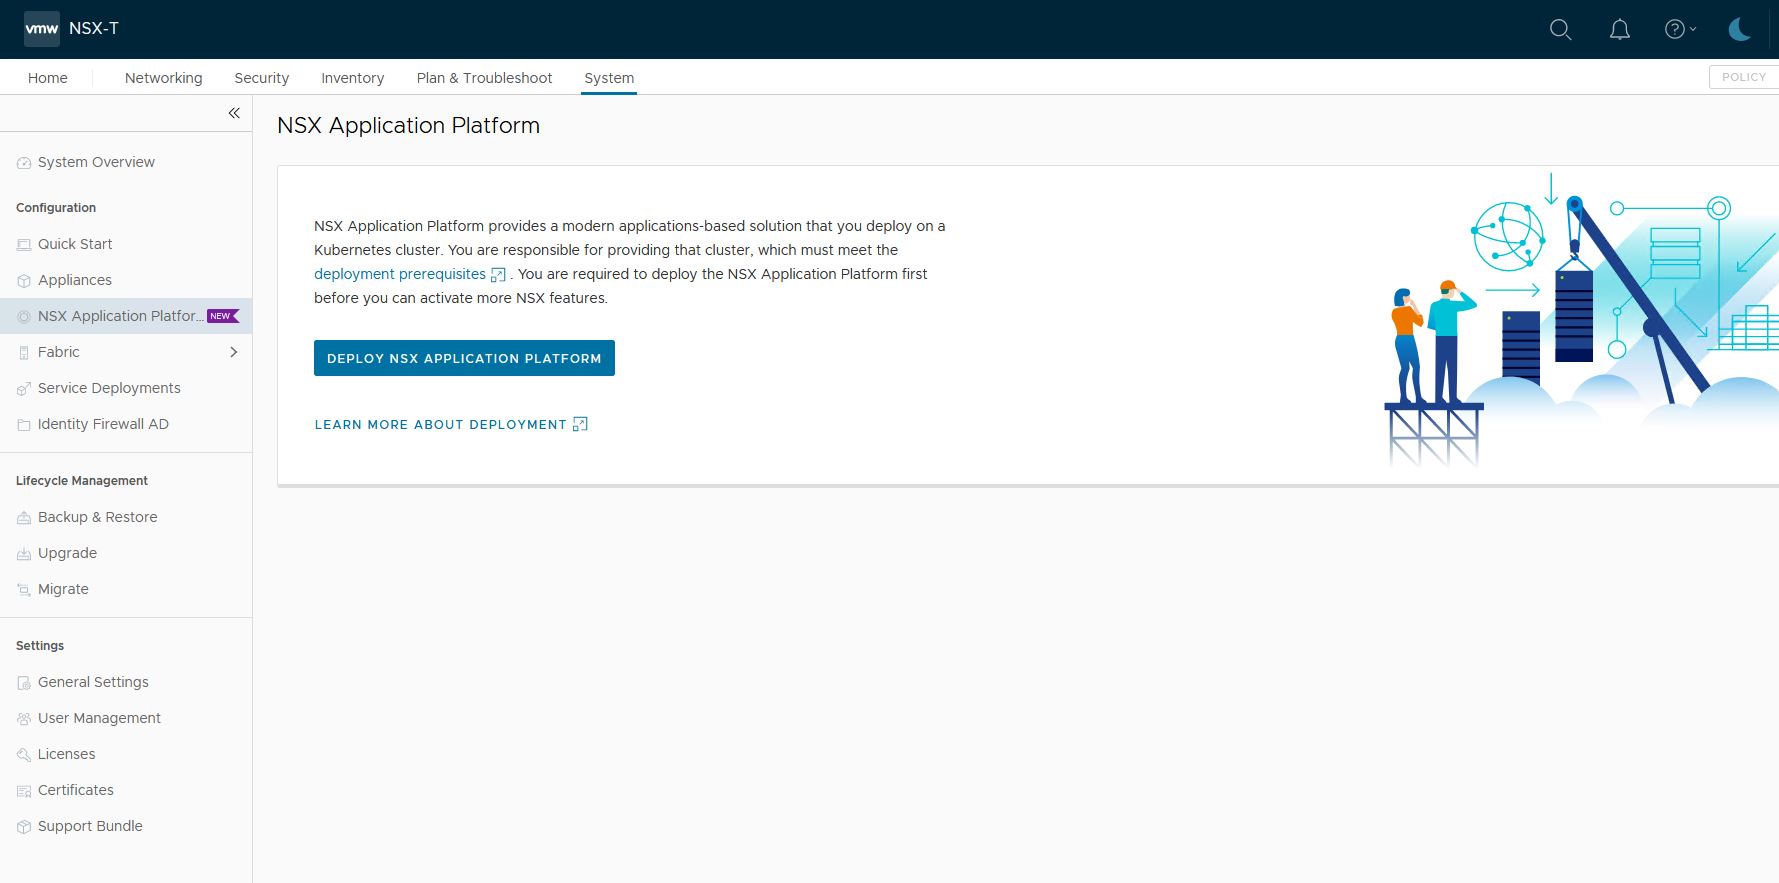
2. Supply the Harbor URL
Helm repository: https://harbor.fqdn.nl/chartrepo/nsx
Docker Registry: harbor.fqdn.nl/nsx/clustering
Do not use ‘https://’ for the Docker Registry. Docker will use https:// by default. Adding https here, will result in https://https://
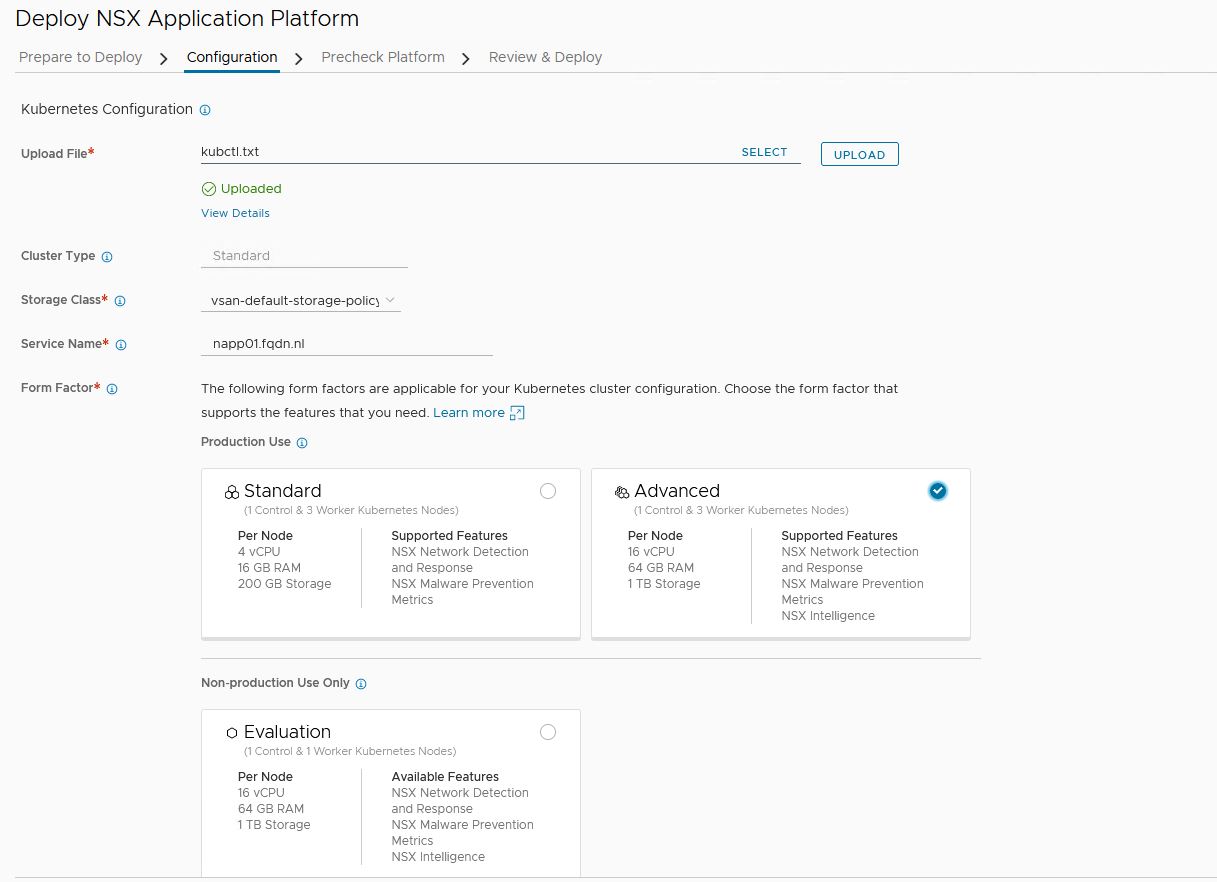
3. Configuration
- Select and upload the kubectl.txt file that is created.
NSX will check if it can connect to Kubernetes. A common issue here might be a firewall. NSX will show a connection error if that is the case. - Select the storage class vsan-default-storage-policy
- Select the name for the service
Important note here: napp01.fqdn.nl resolves to 10.4.205.4
10.4.205.4 is a free ip address in the Ingress range 10.4.205.0/24 (Created in Part 1)
It is important that you pick an ip from this range. Else you will get an error when deploying contour. - Select Advanced version. (I have prepared a cluster specific for Advanced version in Part 2)
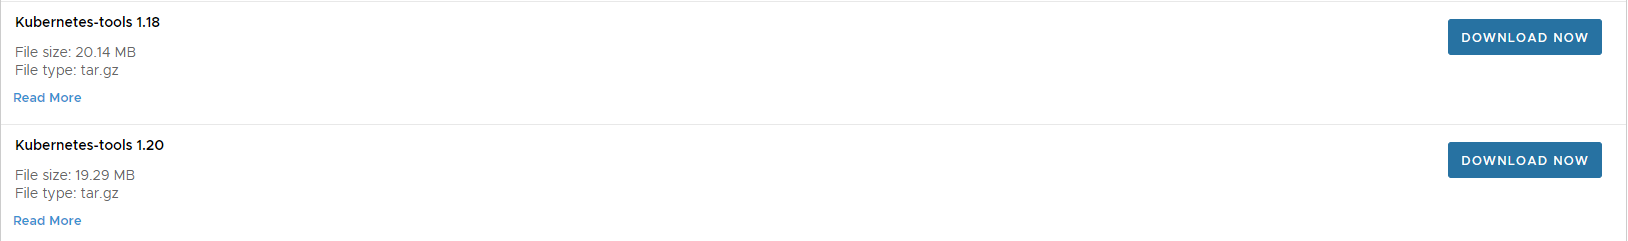
Note: When installing NAPP for the first time, NSX will give a message
‘Server version x.x.x and client version v1.18.20 are incompatible. Please upload Kubernetes Tools to resolve.‘
You can download the appropriate file here
I am using Kubernetes 1.21, so you need 1.20
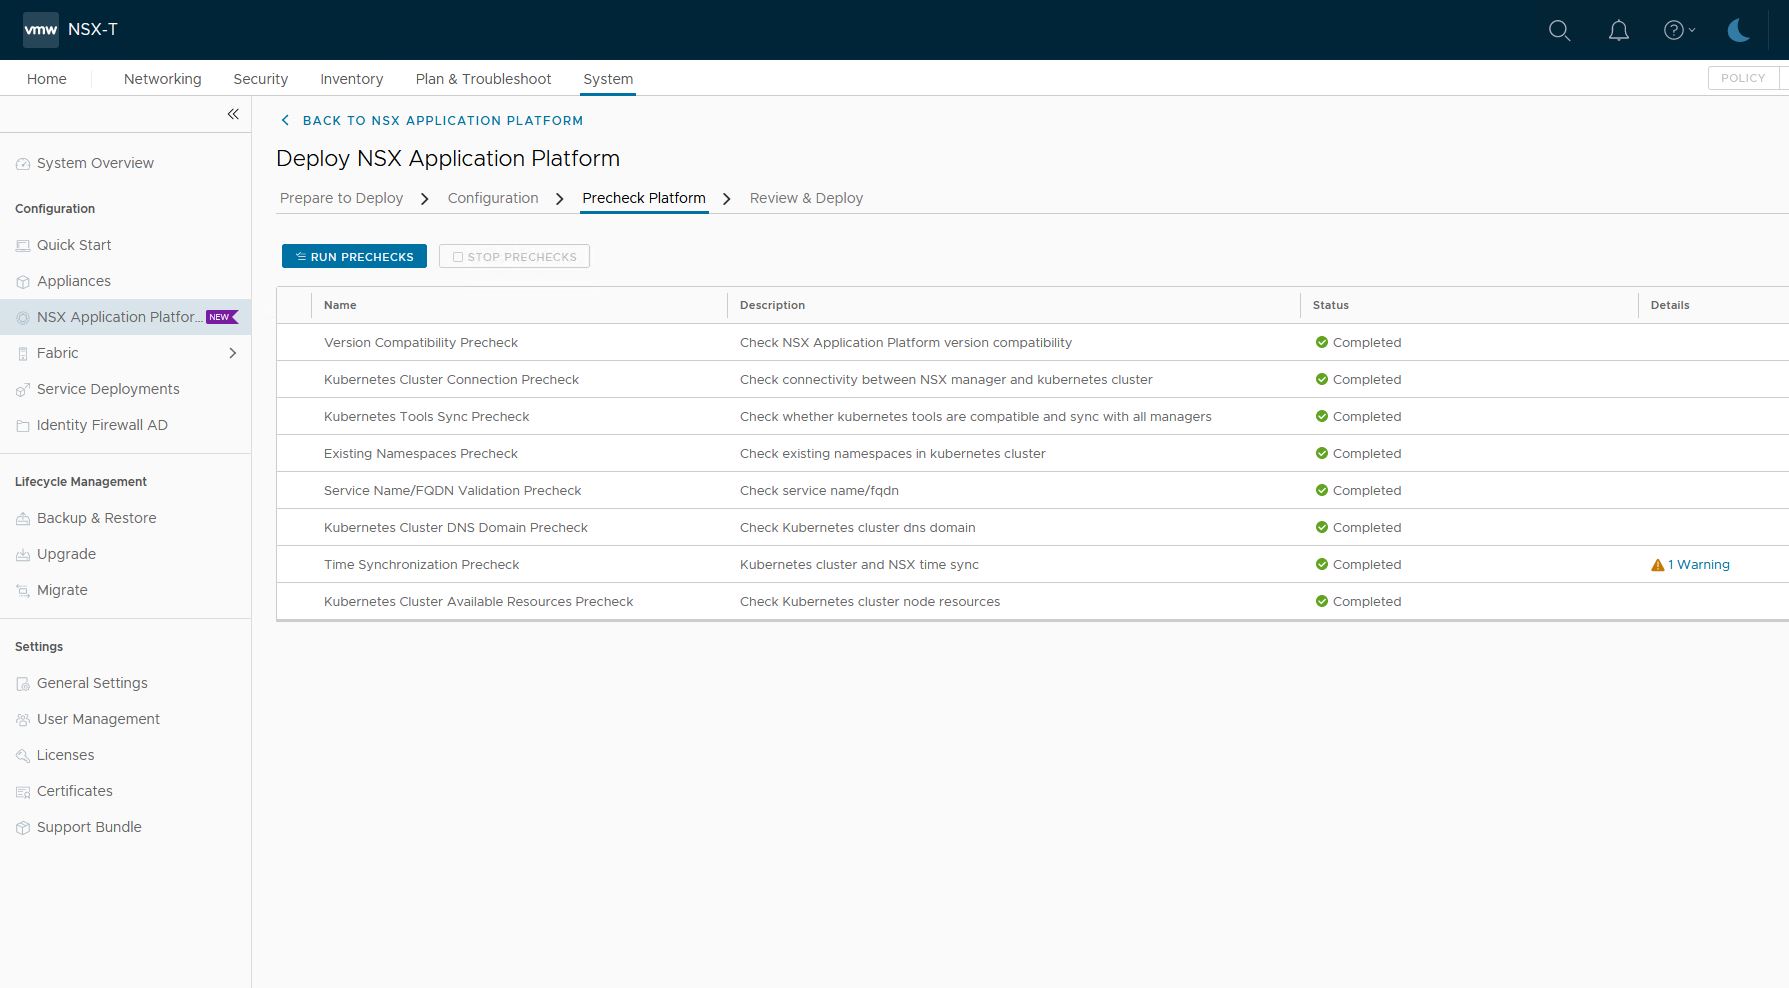
4. Pre checks
On the next tab, NSX will do some prechecks.
All need to be green, else NSX cannot continue with the installation.
The one working is a Time sync warning, which I will just ignore for now.
A common error I ran into was the last step. The cluster needs to be 1 control node and 3 worker nodes with the correct number of CPU, memory, and storage. If that step fails, check those 3 settings.
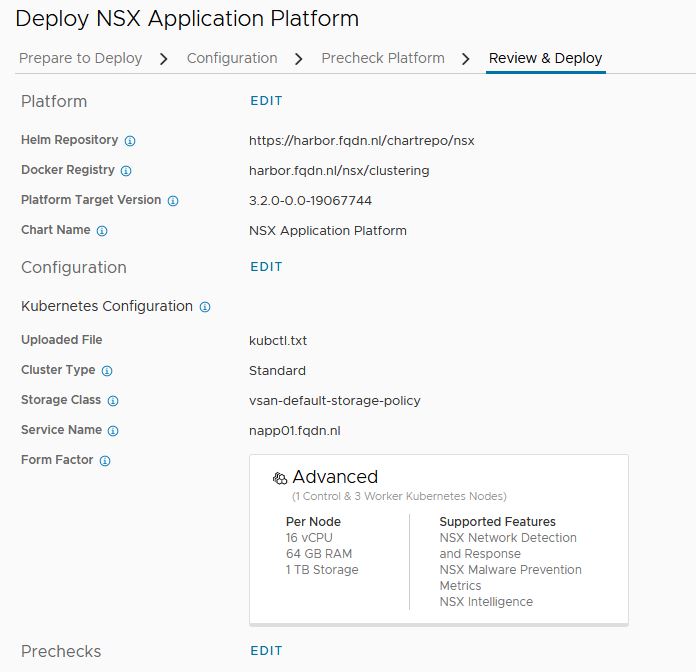
5. Review and Deploy
If everything is green, you are allowed to go to the last step. It is just a summary. Press deploy and here we go 🙂
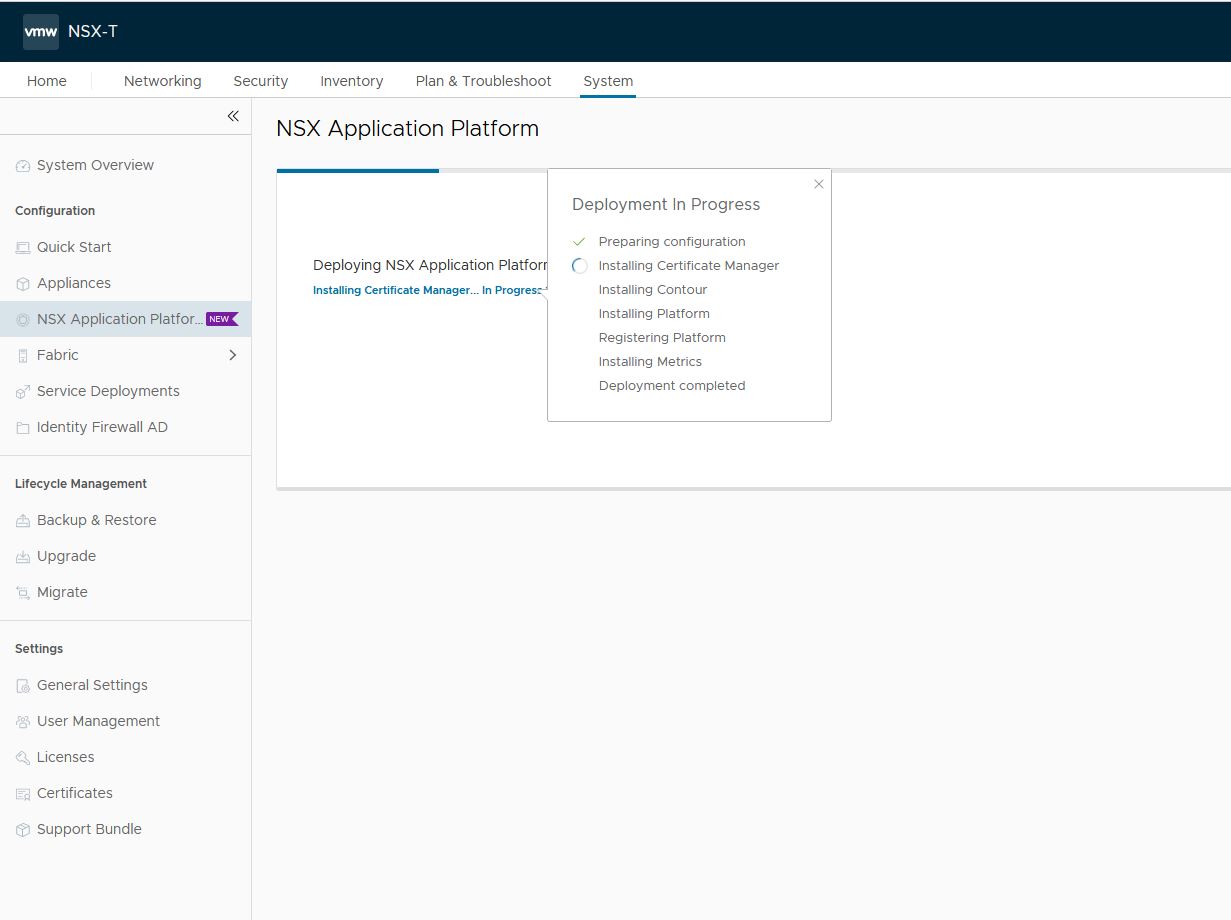
6. Deployment
NSX will install the components one by one and only continue to the next if the previous was successful.
A lot of things can go wrong here (like it did with my install for around 30 times :))
Things where you can run into:
- Docker can not pull the image from Harbor.
Check Kubernetes
$ kubectl get pods -n cert-manager
NAME                                               READY   STATUS         RESTARTS   AGE
cert-manager-576654bc8d-k4pqt                      0/1     ErrImagePull   0          10s
Check why you get the error. If you have a certificate error, it will show ‘ x509: certificate signed by unknown authority’
$ kubectl describe pods -n cert-manager cert-manager-576654bc8d-k4pqt
Name:         cert-manager-576654bc8d-k4pqt
Namespace:    cert-manager
<snip>
x509: certificate signed by unknown authority
<snip>
Try to resolve this issue and press Retry.
- A second thing I ran into is called DiskPressure. This means Kubernetes can not continue because of disk issues.
This is called a taint.
Taints and tolerations work together to ensure that pods are not scheduled onto inappropriate nodes. One or more taints are applied to a node; this marks that the node should not accept any pods that do not tolerate the taints.
The control node already has a taint: NoSchedule, so it does not schedule containers on it.
The worker nodes, however, should not have a taint. This will stop NAPP from deploying.
$ kubectl get nodes -o jsonpath="{range .items[*]}{.metadata.name} {.spec.taints[?(@.effect=='NoSchedule')].effect}{\"\n\"}{end}"
tkgs-v2-cluster-default-control-plane-22xsr NoSchedule
tkgs-v2-cluster-default-worker-nodepool-a1-kkdsj-7c4b9b457lgn9w NoSchedule
tkgs-v2-cluster-default-worker-nodepool-a1-kkdsj-7c4b9b457lr6ds NoSchedule
tkgs-v2-cluster-default-worker-nodepool-a1-kkdsj-7c4b9b457ptjbg NoSchedule
$ kubectl describe node tkgs-v2-cluster-default-worker-nodepool-a1-kkdsj-7c4b9b457lgn9w | grep -i disk
DiskPressure True Fri, 07 Jan 2022 14:54:44 -0500 Mon, 03 Jan 2022 06:51:28 -0500 KubeletHasDiskPressure kubelet has disk pressureIn my case, I had to increase the mounted volume /var/lib/containerd to 64GB. (See part 2). It means Kubernetes does not have enough disk space for the docker images to be stored.
- If the install fails at ‘Installing Contour’, check the resolve of napp01.fqdn.nl
Check for the error in Kubernetes
$ kubectl get services -n projectcontour
NAME                   TYPE           CLUSTER-IP    EXTERNAL-IP   PORT(S)                      AGE
projectcontour         ClusterIP      10.6.64.228   <none>        8001/TCP                     9h
projectcontour-envoy   LoadBalancer   10.6.67.253   10.4.205.4    80:30165/TCP,443:32152/TCP   9h

$ kubectl describe  services -n projectcontour projectcontour-envoy
If all went well, you will be directed to NSX Application Platform page.
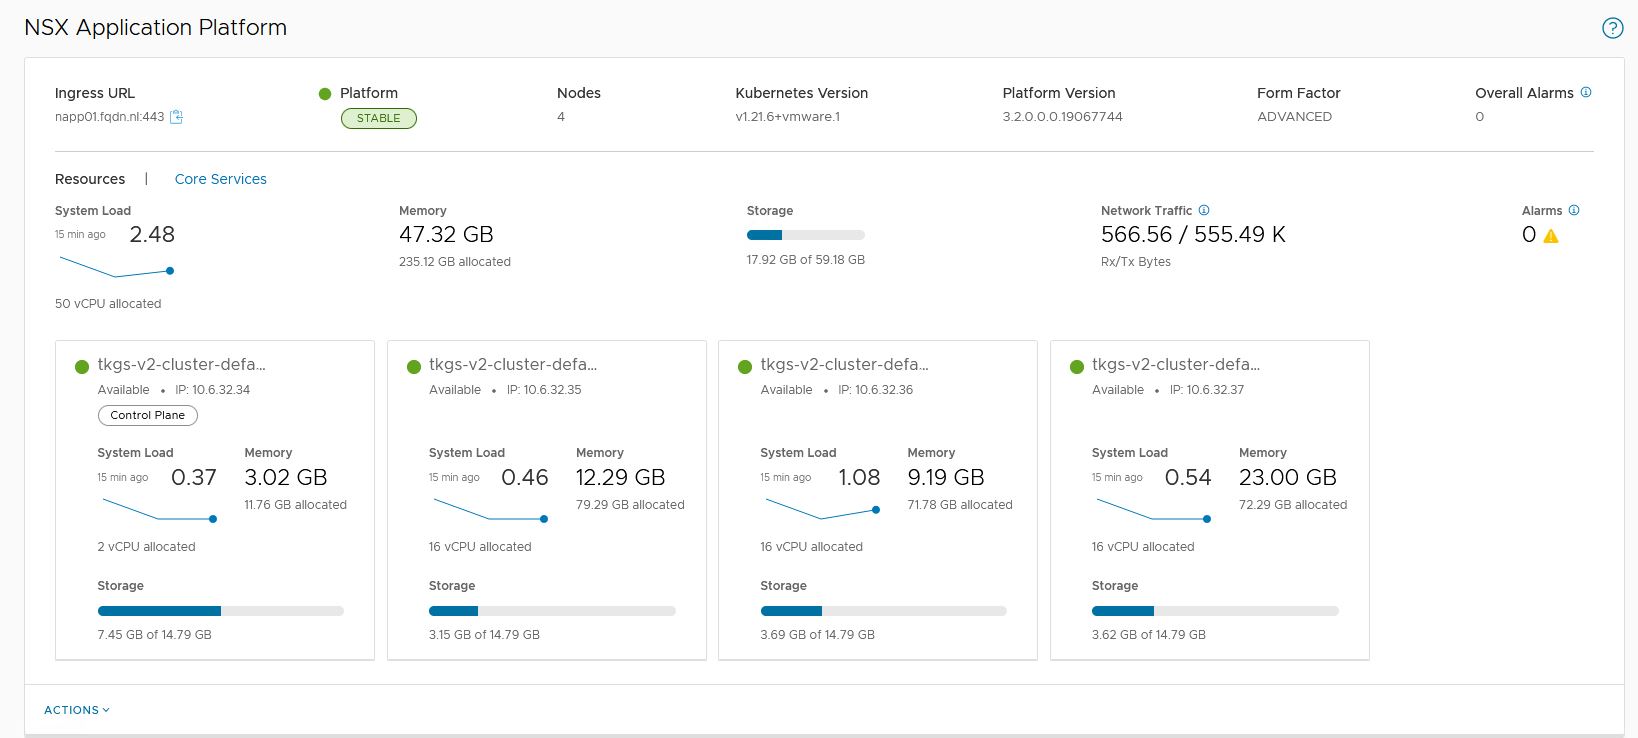
Check if all services are running.
$ kubectl get statefulset -n nsxi-platform
NAME                               READY   AGE
druid-config-historical            1/1     38m
druid-historical                   2/2     38m
druid-middle-manager               3/3     38m
fluentd                            1/1     38m
kafka                              3/3     38m
metrics-postgresql-ha-postgresql   3/3     30m
minio                              4/4     38m
postgresql-ha-postgresql           1/1     38m
redis-master                       1/1     38m
redis-slave                        2/2     38m
zookeeper                          3/3     38m
NSX Intelligence
VMware NSX Intelligence provides a graphical user interface to visualize the security posture and network traffic flows that have occurred in your on-premises NSX-T Data Center environment.
Beginning with version 3.2, NSX Intelligence has transitioned from being a VM-based appliance to a modern application that is hosted on the VMware NSX Application Platform, a platform based on a microservices architecture.
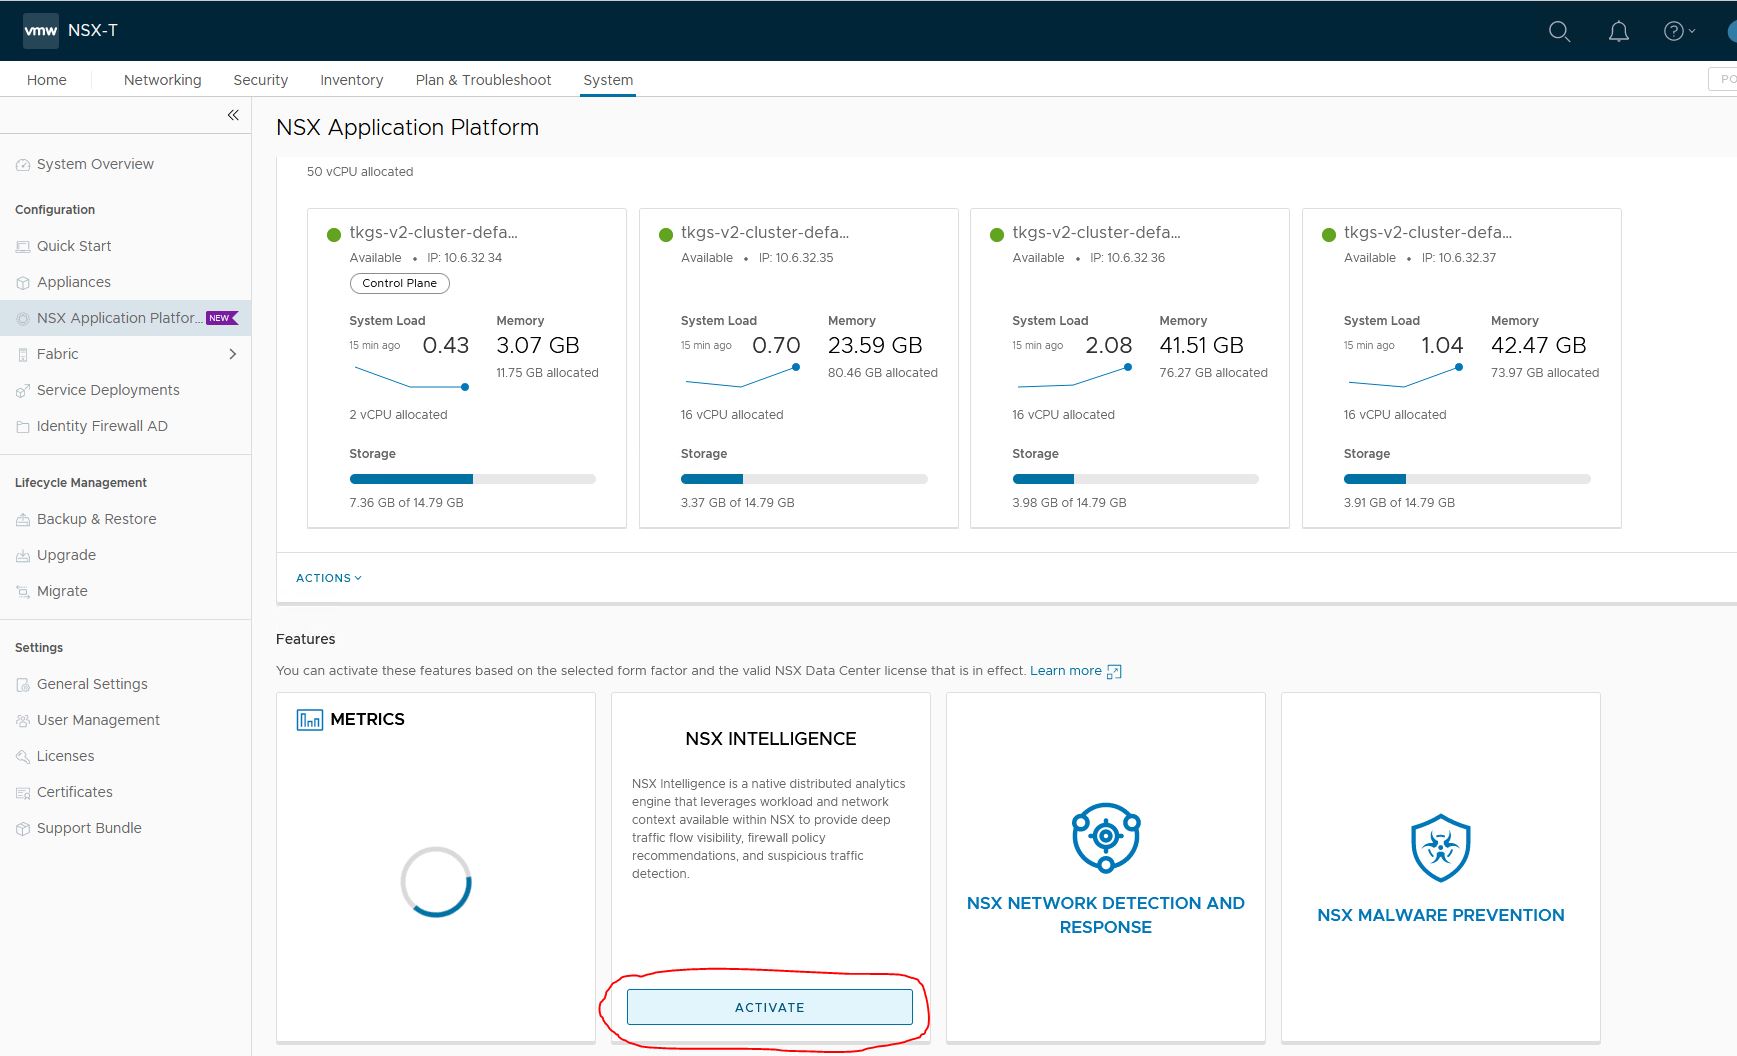
- Activate NSX Intelligence
Goto System->NSX Application Platform
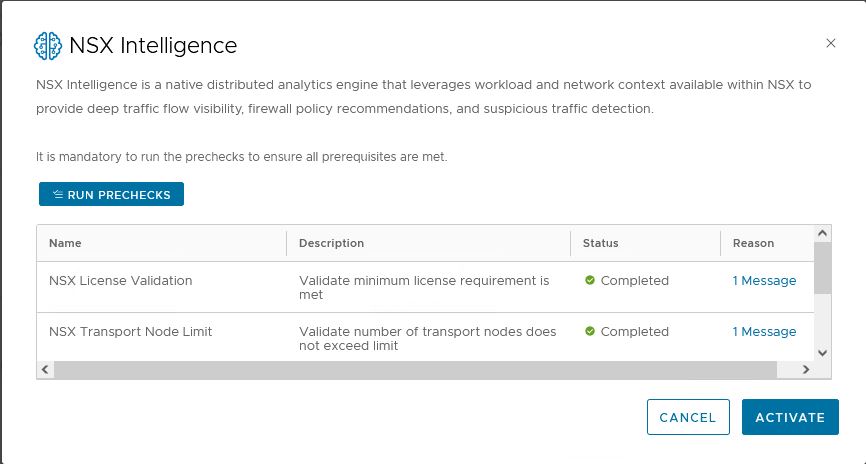
2. Prechecks
NSX will do some prechecks
3. Check that intelligence is running
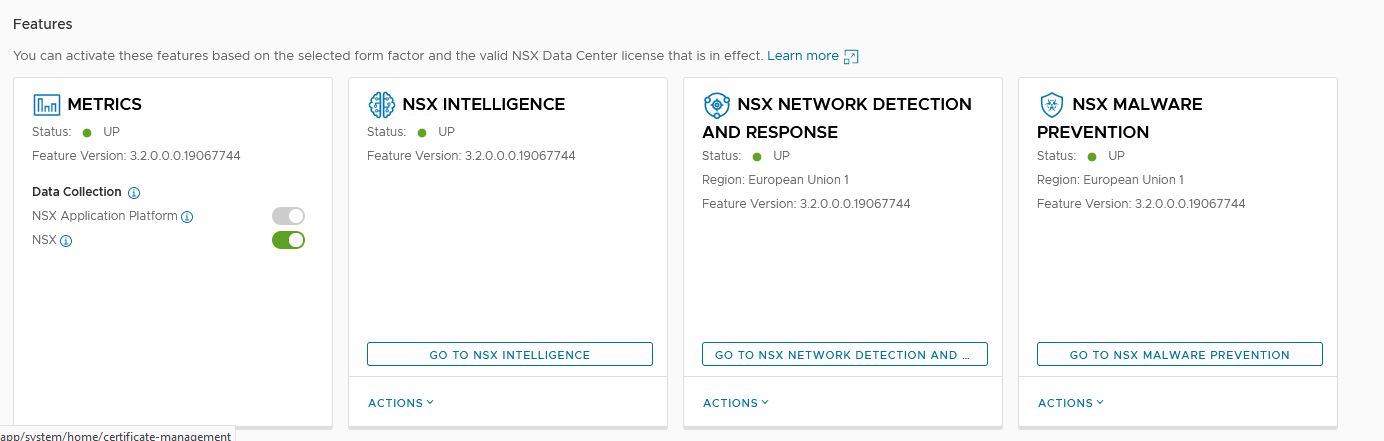
The NAPP dashboard will show ‘Status UP’ when the activation is completed.
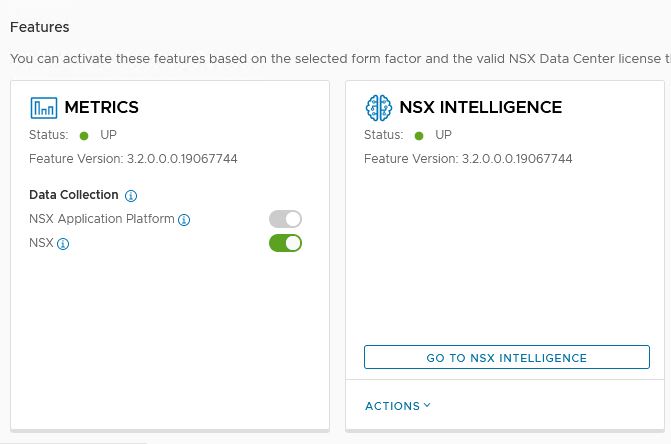
Check Kubernetes and verify everything is up and running.
$ kubectl get pods -n nsxi-platform -l app.kubernetes.io/instance=intelligence
NAME                                         READY   STATUS      RESTARTS   AGE
contextcorrelator-ab71fb7e344b7f98-exec-1    2/2     Running     0          53m
data-archiver-74687c49d8-mlffw               1/1     Running     0          54m
data-collection-79c9cf97fc-7mp6d             1/1     Running     0          54m
intelligence-ui-7ffbc8d77b-82rdj             1/1     Running     0          54m
latestflow-59c5f6b94b-d7sfx                  1/1     Running     0          54m
latestflow-59c5f6b94b-ljpqv                  1/1     Running     0          54m
latestflow-59c5f6b94b-pw4k5                  1/1     Running     0          54m
llanta-detectors-0                           4/4     Running     0          54m
nsx-config-784ff97657-m5w5r                  1/1     Running     0          54m
nsxi-post-install-jobs-ld875                 0/1     Completed   0          54m
nta-server-5887749b79-ms9m7                  2/2     Running     0          54m
overflowcorrelator-5c2b167e344b7600-exec-1   2/2     Running     0          53m
overflowcorrelator-5c2b167e344b7600-exec-2   2/2     Running     0          53m
overflowcorrelator-5c2b167e344b7600-exec-3   2/2     Running     0          53m
processing-create-kafka-topic-job-z4k85      0/1     Completed   0          54m
processing-pod-cleaner-27359300-7bpmh        0/1     Completed   0          80s
pubsub-69d675cd58-42mfp                      1/1     Running     0          54m
rawflowcorrelator-111c667e344b7626-exec-1    2/2     Running     0          53m
rawflowcorrelator-111c667e344b7626-exec-2    2/2     Running     0          53m
rawflowcorrelator-111c667e344b7626-exec-3    2/2     Running     0          53m
recommendation-cb5856cfb-q9xz8               2/2     Running     0          54m
spark-app-context-driver                     2/2     Running     0          54m
spark-app-overflow-driver                    2/2     Running     0          54m
spark-app-rawflow-driver                     2/2     Running     0          54m
spark-job-manager-5cdfdbbb75-c6g6d           1/1     Running     0          54m
visualization-66d655f6bf-495vv               1/1     Running     0          54m
NSX Network detection and response
VMware NSX Network Detection and Response provides a tightly integrated set of
network detection and response capabilities for east-west security within the data
center and multi-cloud environments. VMware NSX Network Detection and
Response has the broadest set of detection capabilities that span network IDS/IPS,
behavior-based network traffic analysis, as well as VMware NSX Advanced Threat
Analyzer, a sandbox offering based on a full-system emulation technology that has
visibility into every malware action.
- Activate NSX Network detection and response
Goto System->NSX Application Platform
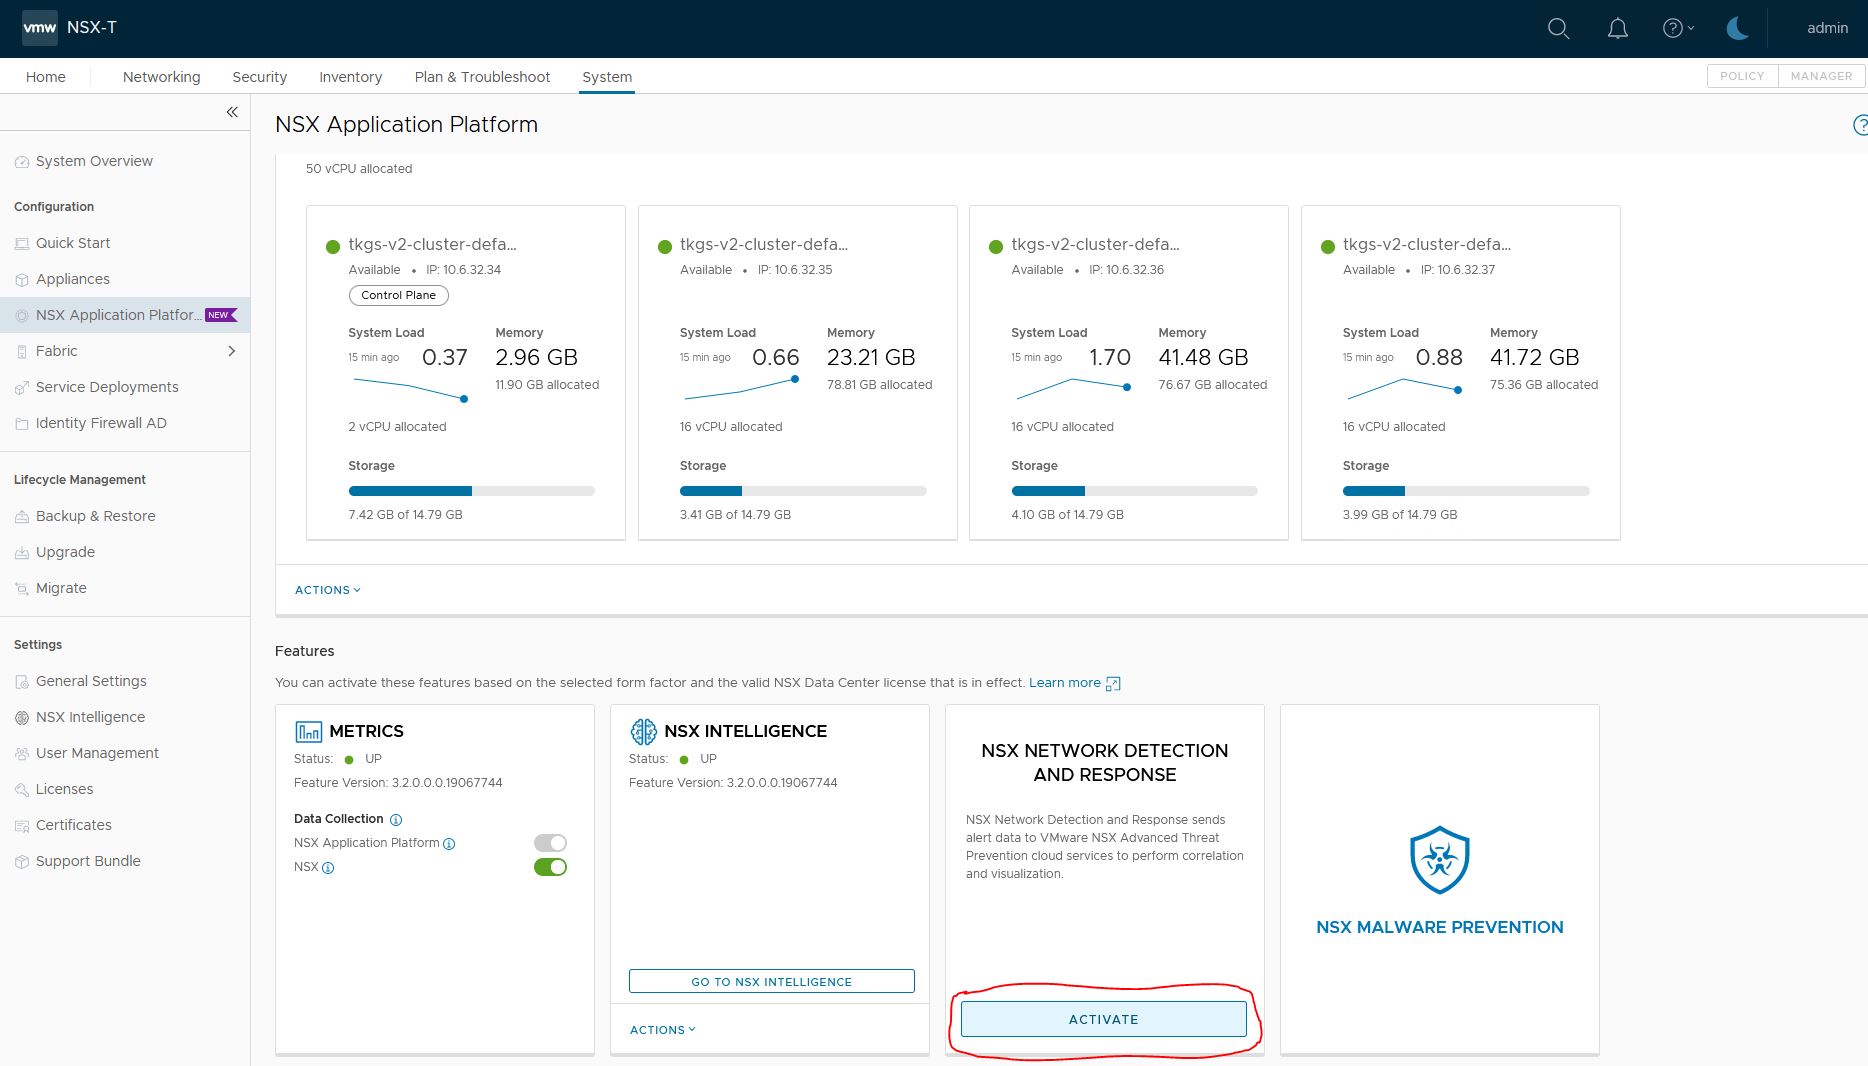
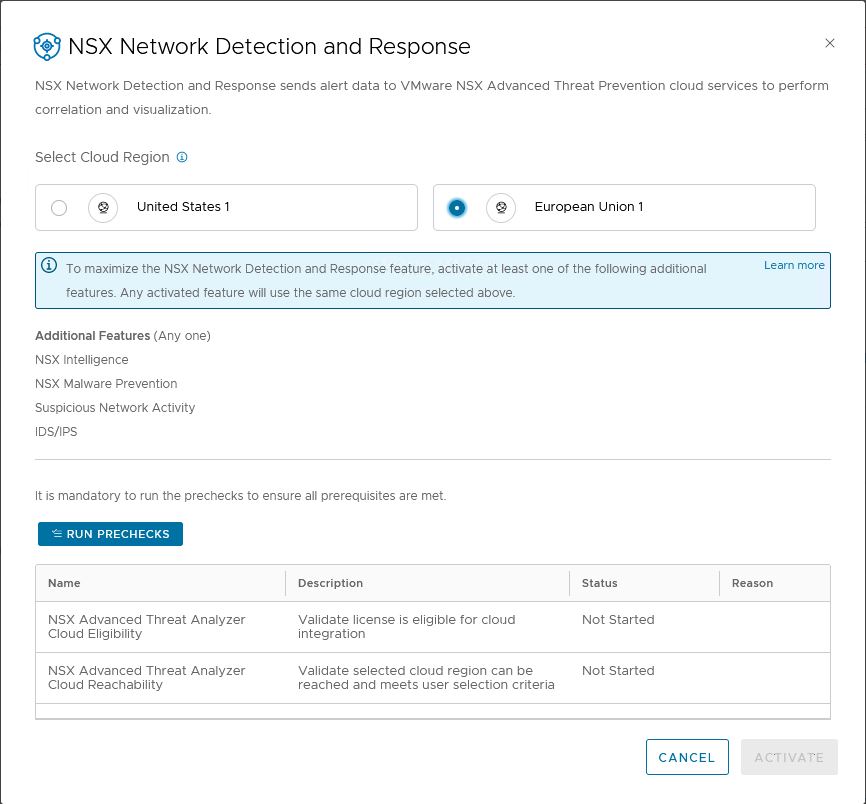
2. Region selection and precheck
NSX will do some precheck.
Select the region you want to use. I am in Europa, so i picked that one.
An important note here: NAPP is running on Kubernetes and needs internet access to connect to the region.
Since my setup is without internet access, I need to create some nat rules to allow traffic to lastline.
NSX will connect to: nsx.lastline.com (38.95.226.10)
Use your browser to go to
https://nsx.lastline.com/nsx/cloud-connector/api/v1/papi/accounting/nsx/get_cloud_regions.json
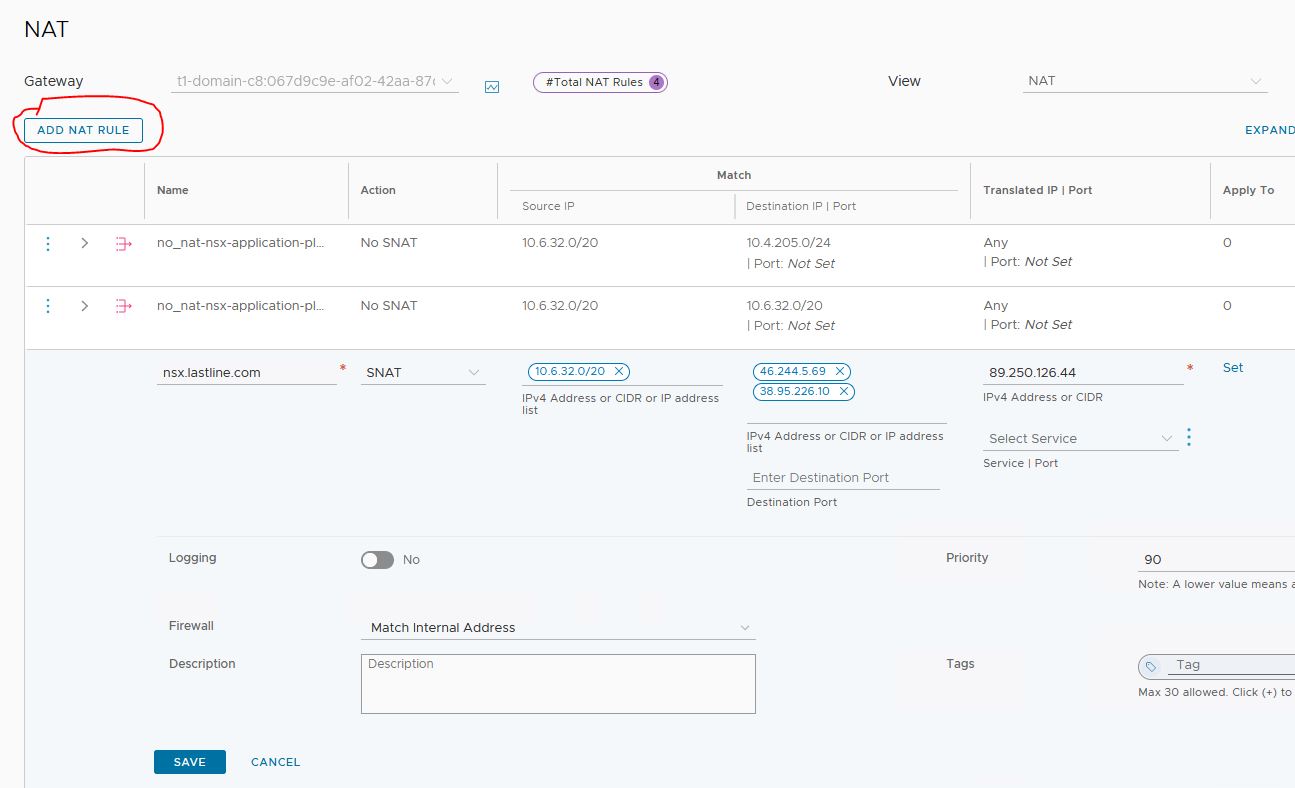
{"success": 1, "data": [{"region": "west.us", "region_name": "United States 1", "fqdn": "nsx.west.us.lastline.com"}, {"region": "nl.emea", "region_name": "European Union 1", "fqdn": "nsx.nl.emea.lastline.com"}]}And will connect to (for my region): nsx.nl.emea.lastline.com (46.244.5.69)
Goto NSX manager->Networking->NAT, and find the Tier1-gateway responsible for nsx-application-platform namespace.
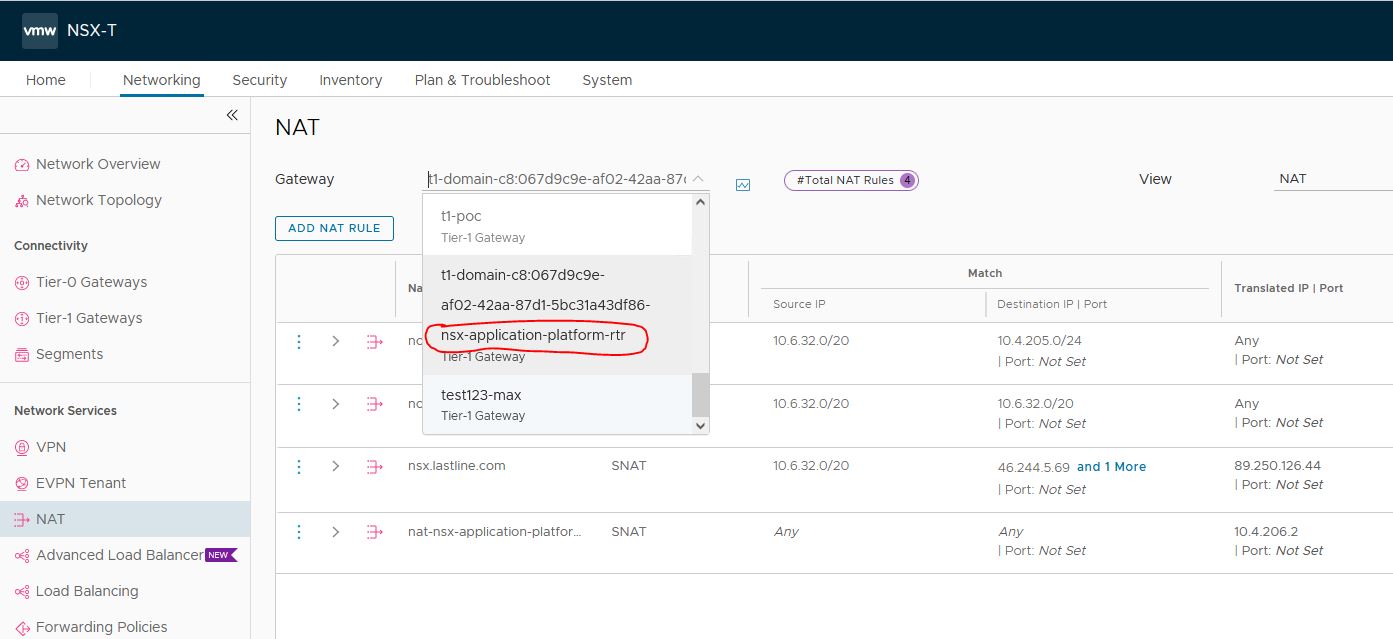
Add the 2 IP addresses to nat settings. Put priority on 90
10.6.32.0/20 is the CIDR assigned to our Tanzu cluster for NAPP
Continue with the activation
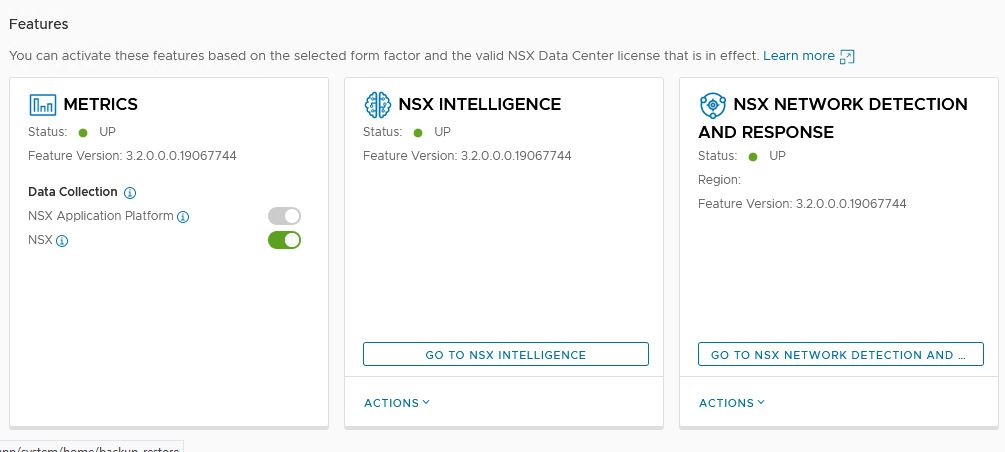
3. Check if NSX Network detection and response is running
Status should show UP
Check Kubernetes
$ kubectl get pods -n nsxi-platform -l app.kubernetes.io/instance=cloud-connector
NAME READY STATUS RESTARTS AGE
cloud-connector-check-license-status-655f8f8f89-q77bt 2/2 Running 0 70s
cloud-connector-proxy-74b488d5cd-22csr 2/2 Running 0 70s
cloud-connector-register-qwk9m 0/2 Completed 0 85s
cloud-connector-update-license-status-5789cbfc9f-2l5b4 2/2 Running 0 70s
$ kubectl get pods -n nsxi-platform -l app.kubernetes.io/instance=nsx-ndr
NAME READY STATUS RESTARTS AGE
nsx-ndr-enable-ids-v5tk5 0/1 Completed 0 2m19s
nsx-ndr-feature-switch-watcher-notifier-ndr-66fd9455d6-p7clq 1/1 Running 0 2m16s
nsx-ndr-setup-kafka-ddq8v 0/1 Completed 0 2m37s
nsx-ndr-upload-config-77b8b6856d-j7q2c 2/2 Running 0 2m16s
nsx-ndr-worker-file-event-processor-655cb88c6-6vkwt 2/2 Running 0 2m16s
nsx-ndr-worker-file-event-uploader-7d857c867d-7c8xj 2/2 Running 0 2m16s
nsx-ndr-worker-ids-event-processor-5d7bcc5d97-pt4q9 2/2 Running 0 2m16s
nsx-ndr-worker-monitored-host-processor-cf68585-vqtwl 2/2 Running 0 2m16s
nsx-ndr-worker-monitored-host-uploader-667b444fc-nqlzw 2/2 Running 0 2m15s
nsx-ndr-worker-ndr-event-processor-9f98fc856-cwq6h 2/2 Running 0 2m15s
nsx-ndr-worker-ndr-event-uploader-5f8c8b65d-zglrr 2/2 Running 0 2m15s
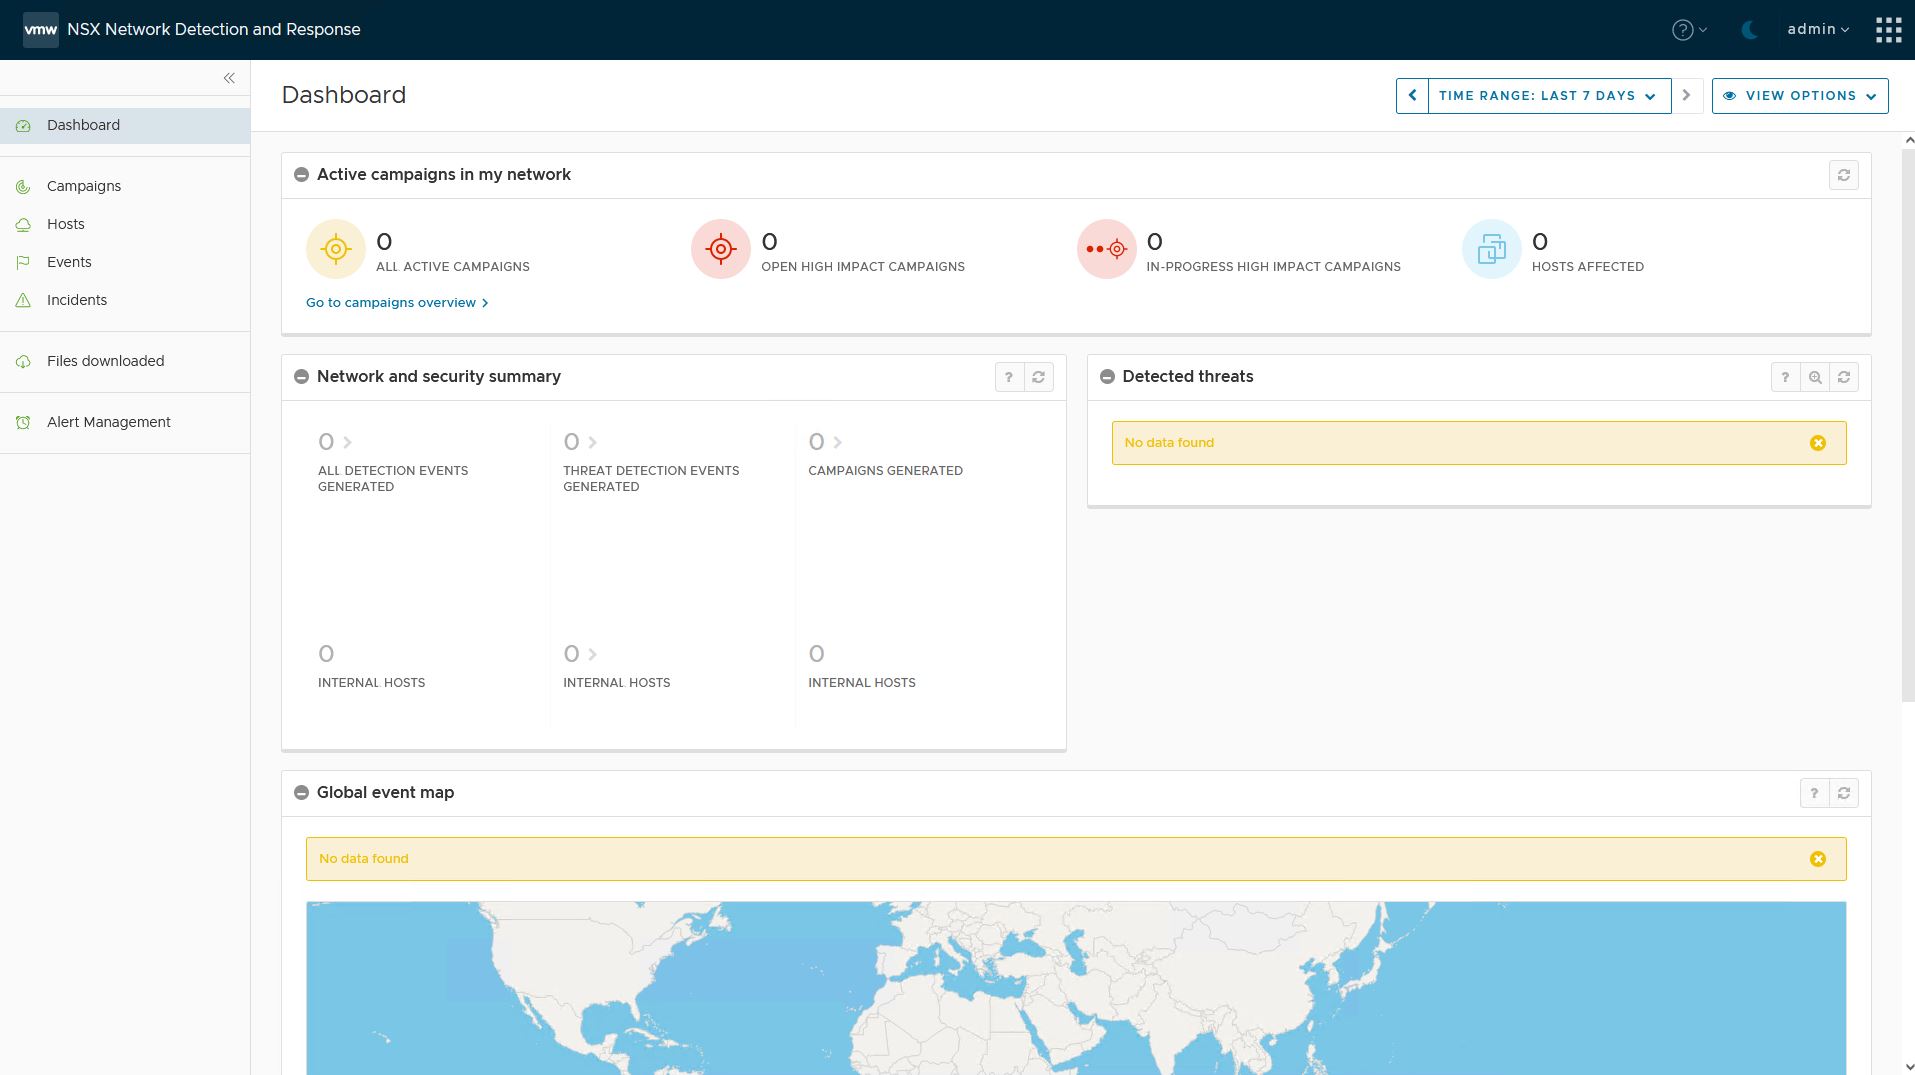
nsx-ndr-worker-nta-event-processor-554c54585-tb7ln 2/2 Running 0 2m15sPress the Goto NSX network detection and response button. This will bring you to the landing page.
NSX Malware Prevention
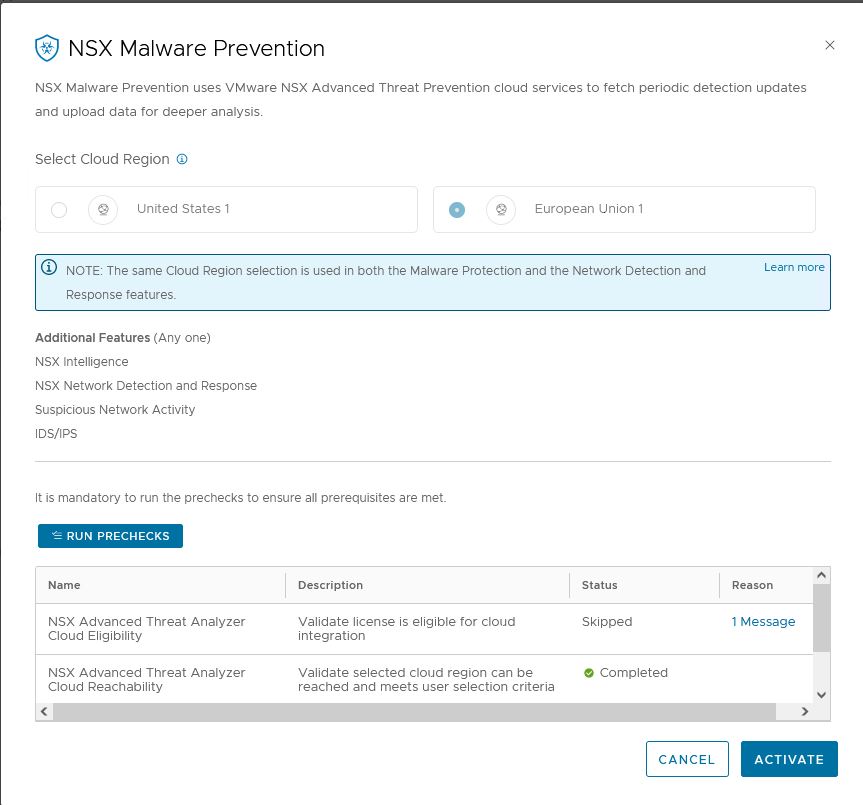
- Activate NSX Malware Prevention
Goto System->NSX Application Platform
Press activate
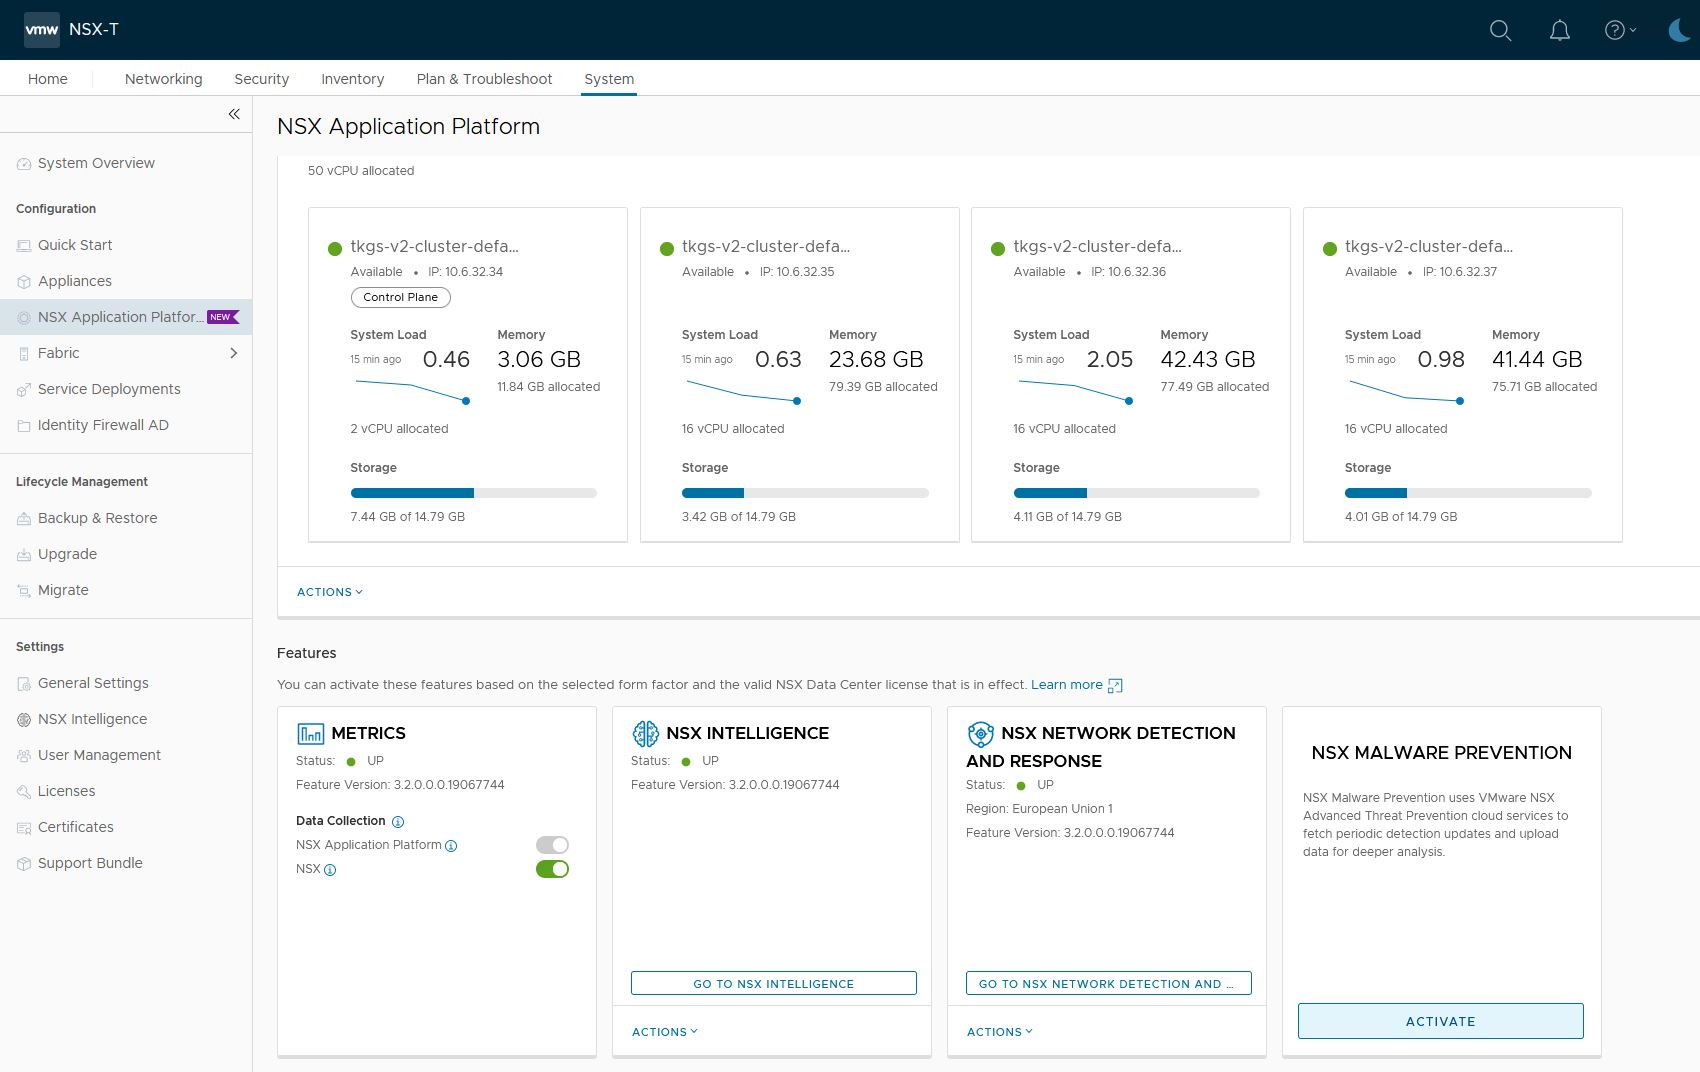
2. Prechecks
NSX will do some prechecks. It will auto-select the region used in NSX network detection and response, and skips the License Validation
3. Check if NSX malware prevention is running.
Status should show UP
Check Kubernetes.
$ kubectl get pods -n nsxi-platform -l app.kubernetes.io/instance=reputation-service
NAME                                                              READY   STATUS        RESTARTS   AGE
reputation-service-68fc56557-vnt57                                1/1     Running       0          55s
reputation-service-7bcc8c8544-2wvv6                               0/1     Running       0          6s
reputation-service-7fb5b555c9-fxj7w                               1/1     Terminating   0          55s
reputation-service-feature-switch-watcher-notifier-dependefbq4b   1/1     Running       0          55s

$ kubectl get pods -n nsxi-platform -l app.kubernetes.io/instance=malware-prevention
NAME                                                              READY   STATUS      RESTARTS   AGE
malware-prevention-feature-switch-watcher-notifier-ndr-849bgmpn   1/1     Running     0          92s
malware-prevention-ui-76ff6dcd8f-vlv2x                            1/1     Running     0          91s
mps-post-install-jobs-465h9                                       0/1     Completed   0          91s
sa-asds-7bdcc7f8f5-qm26h                                          1/1     Running     0          91s
sa-events-processor-b4c8967c6-4cq8z                               1/1     Running     0          91s
sa-scheduler-services-7d99cccb45-964tt                            1/1     Running     0          91s
sa-web-services-6bf4b484c-dgd7j                                   1/1     Running     0          90s
Congratulations! You have all components running that are part of the NSX Application Platform.
Some issue I ran into
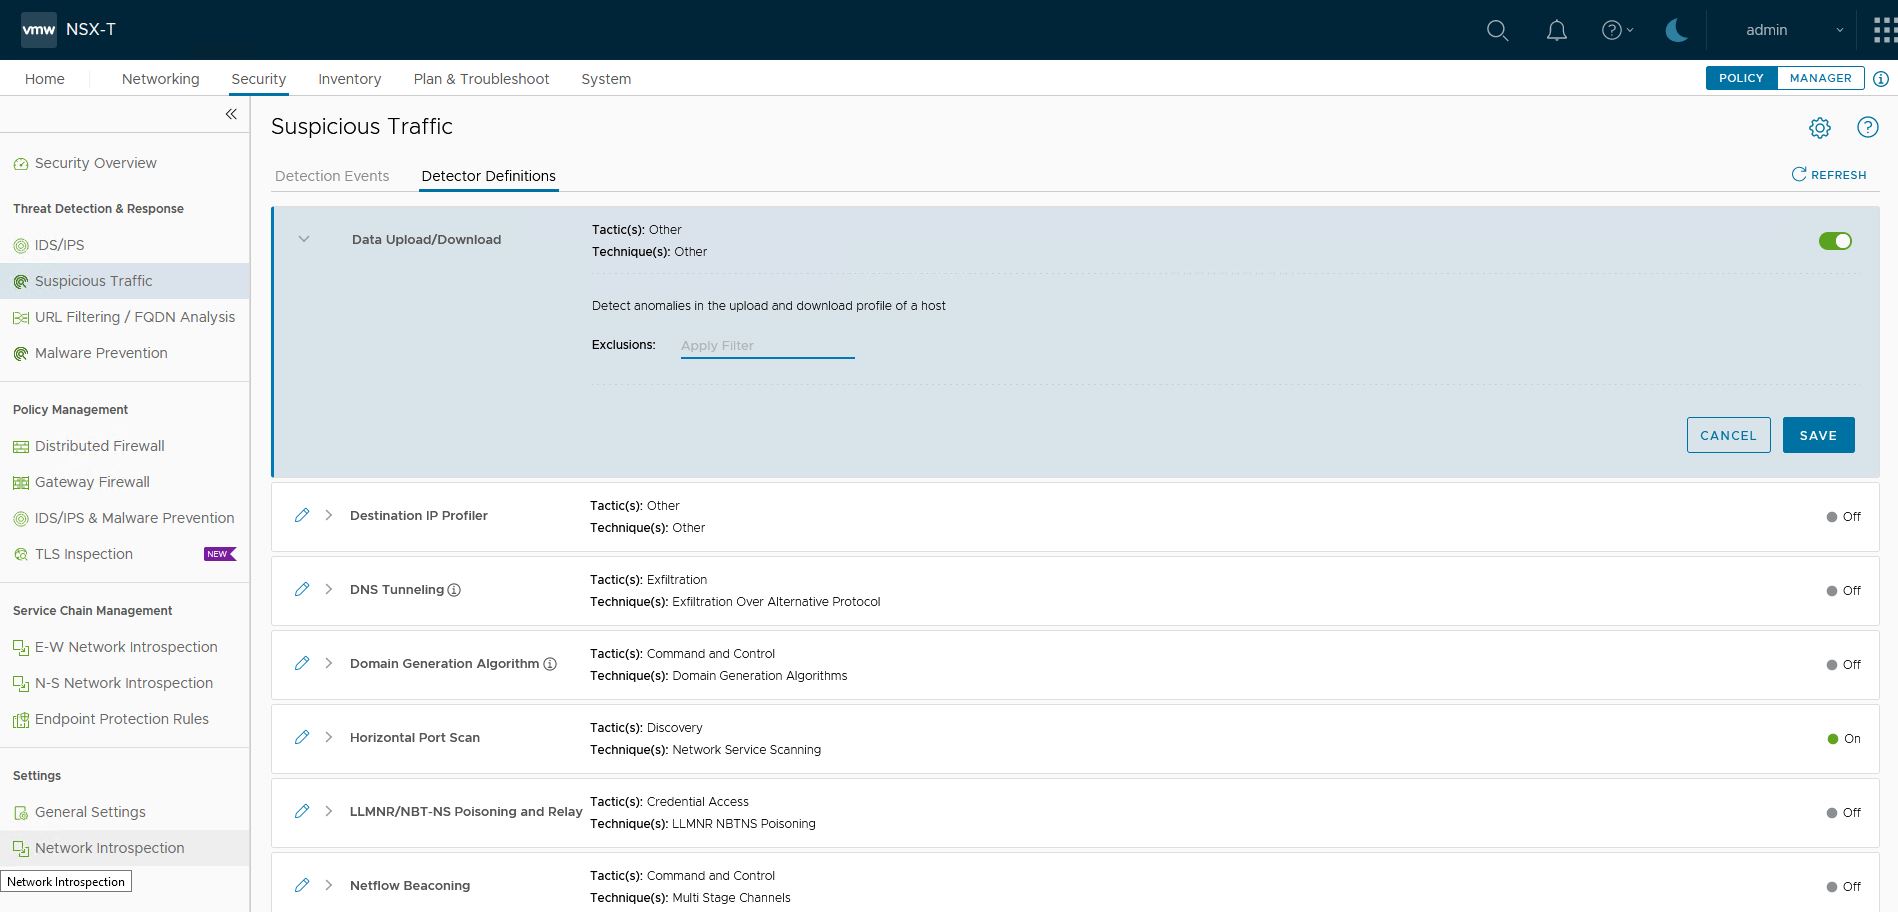
When playing around with Suspicious traffic, I activated some features, and NSX Intelligence stopped working correctly.
Underwater another container is spun up on Kubernetes.
- nta-flow-driver and anomalydetectionstreamingjob
The containter failed with the following message. As you can see it tries to pull an image from harbor-repo.vmware.com
Failed to pull image "harbor-repo.vmware.com/nsx_intelligence/clustering/nta-flow:19067763": rpc error: code = Unknown desc = failed to pull and unpack image "harbor-repo.vmware.com/nsx_intelligence/clustering/nta-flow:19067763": failed to resolve reference "harbor-repo.vmware.com/nsx_intelligence/clustering/nta-flow:19067763": failed to do request: Head "https://harbor-repo.vmware.com/v2/nsx_intelligence/clustering/nta-flow/manifests/19067763": dial tcp: lookup harbor-repo.vmware.com on 127.0.0.53:53: no such host
I solved this by pointing the image to the correct Harbor.
$ kubectl edit pods -n nsxi-platform nta-flow-driver
Change the image location to your own harbor
Successfully pulled image "harbor.fqdn.nl/nsx/clustering/nta-flow:19067763
Conclusion
That concludes the installation. I hope you enjoyed reading my blog and have an awesome time playing around with NAPP.
If you have any suggestions or comments, please let me know!